
Post Electrophoretic Analysis Articles
PCR Analysis: Yield and Kinetics
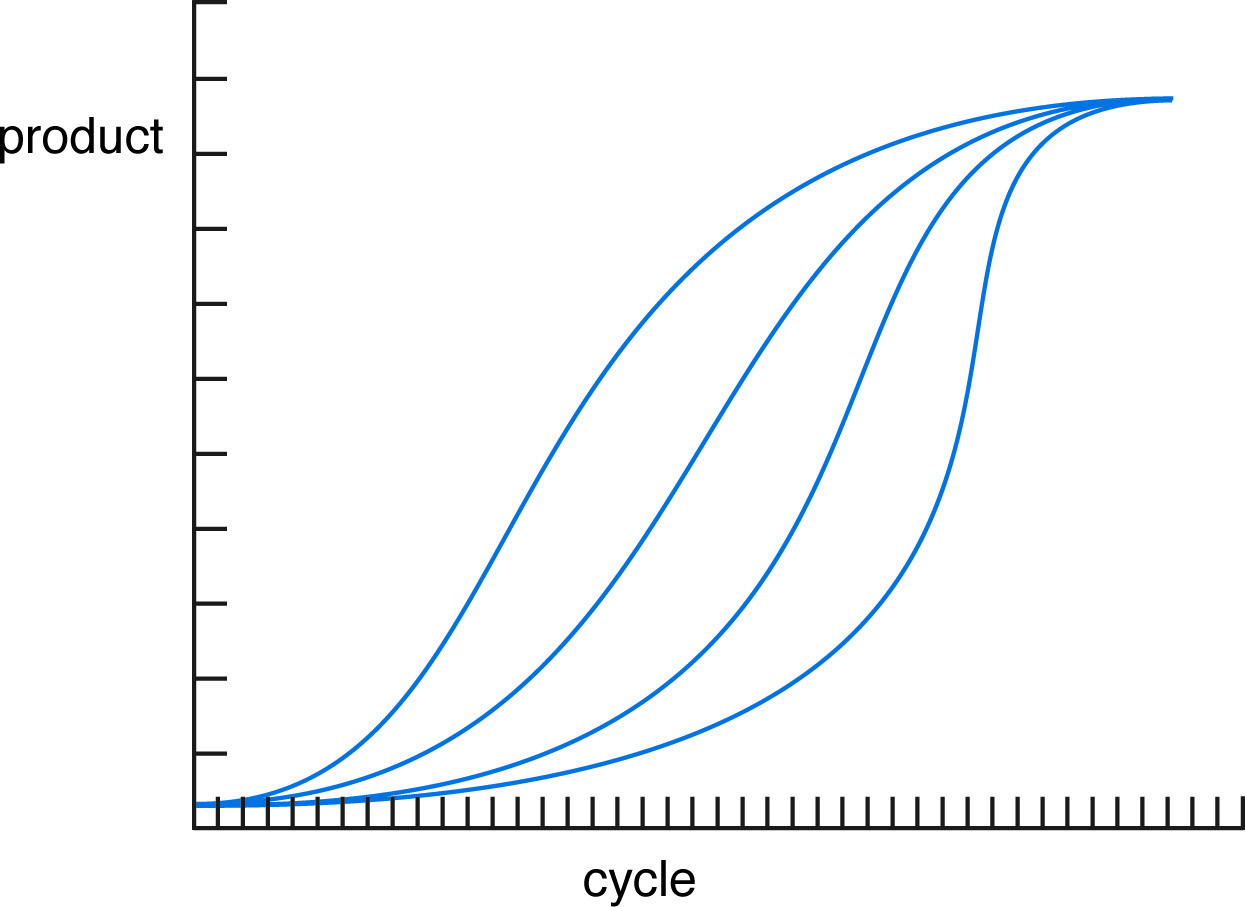
PCR amplification follows an exponential curve until a saturation point is reached, after which further amplification often serves only to degrade purity. Curve shape depends upon the amount of substrate present initially.
PCR reactions produce product in a nonlinear pattern (See figure below). Amplification follows a typical exponential curve until some saturation point is reached. Generally, products will not be further amplified once 1-5 µg has been generated. Saturation by one product of a reaction does not always prevent further amplification of other (generally unwanted) products. As noted above, this means that over-cycling may decrease the quality of an otherwise good reaction. When first optimizing a reaction, it is advisable to take samples every 5 or 10 cycles to determine the number of cycles actually needed.
NEXT TOPIC: Gel Electrophoresis of PCR Products