
Gel Electrophoresis of Proteins
Native Protein Electrophoresis
Proteins run on PAGE in the absence of SDS will separate on the basis of their charge to mass ratio. While native (nondenaturing) PAGE does not provide direct measurement of molecular weight, the technique can provide useful information such as protein charge or subunit composition. Native PAGE also has the potential for separating proteins of identical molecular weight which cannot be resolved with SDS - PAGE. In addition, proteins on native PAGE usually retain their activity. This allows enzymes to be detected by sensitive and specific activity stains and delicate proteins to be resolved and recovered in a biologically active form.
The interpretation of native gels is more complex than the interpretation of SDS - PAGE gels. Not only can differences in relative mobility reflect differences in charge, mass or both, but also, proteins may have a pI at or above the pH of the buffer, in which case they will not migrate or will "retro-phorese" backward into the upper buffer chamber.
The equation governing protein mobility in native gels is as follows:
log Rf = log (Yo) - KRT
where:
- Rf = relative mobility, normalized to the dye front or some other standard.
- Yo = relative mobility of the protein in the absence of any sieving matrix.
- KR = "retardation coefficient," the extent to which the gel matrix affects mobility.
- T = % monomer of the gel matrix.
In the presence of SDS, all proteins have the same Yo, so a simple relationship exists between Rf and KR at any given T. In other words, SDS-treated proteins, having identical charge-to-mass ratios, migrate at the same speed in free solution under electric force. With such proteins, if you know the mechanical resistance exerted by the gel, you can determine the mobility. This mechanical resistance, KR, is directly related to molecular weight so that a determination of KR allows the calculation of molecular weight. In native gels, the situation is more complicated. Both Y0 and KR can vary between proteins. Y0 is related to the charge, while KR varies with the mass.
Ferguson Plots
The separation of protein mixtures and protein standards on gels of varying percentages allows for the determination of both the charge and mass of the sample proteins. The graphic analysis used is known as the Ferguson plot. On the Ferguson plot, the logarithm of Rf is graphed versus T for a range of T (the originators of this system covered 7 different percentage gels). By the above equation, the graph should have a slope of KR and a Y-intercept (at T = 0) of Yo. Comparison with standards of known charge and size allows the determination of the charge and molecular weight of the samples.
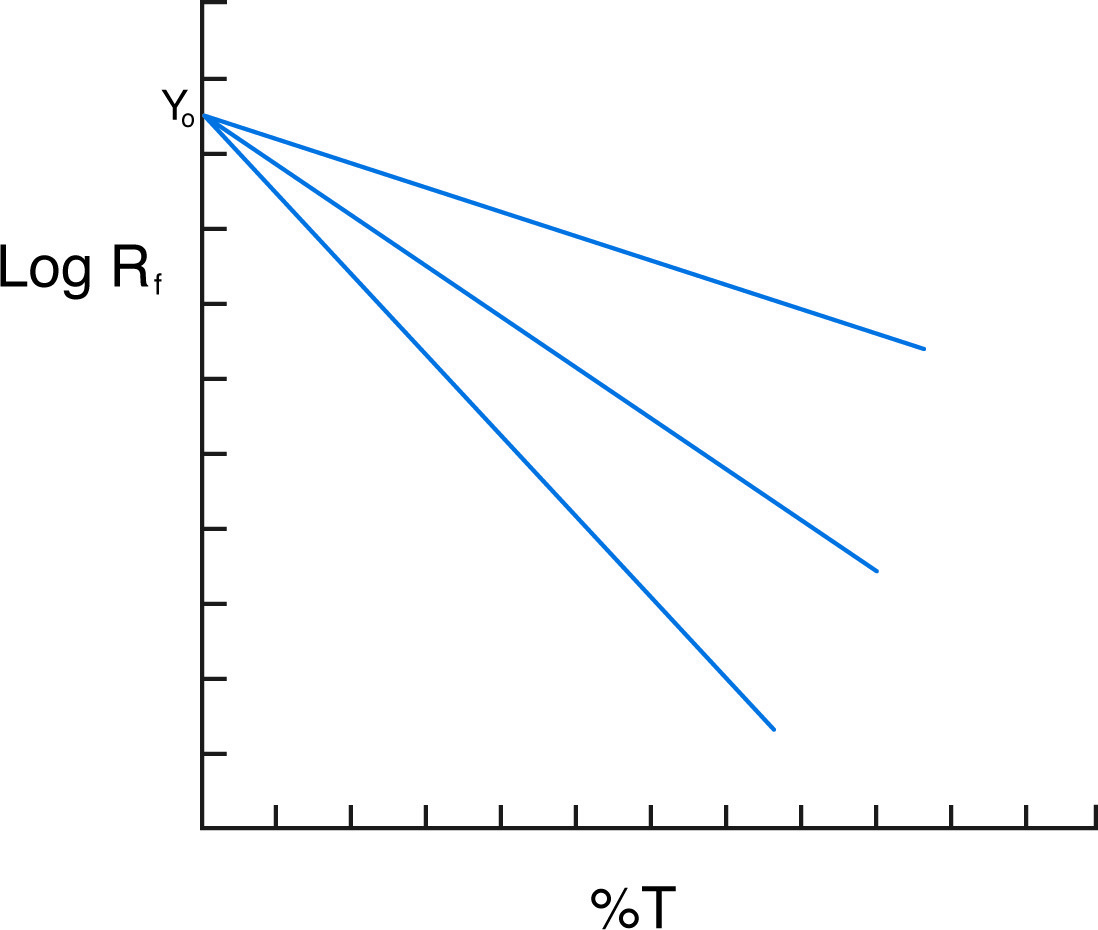
Ferguson plot shows three proteins of the same charge but different mass.
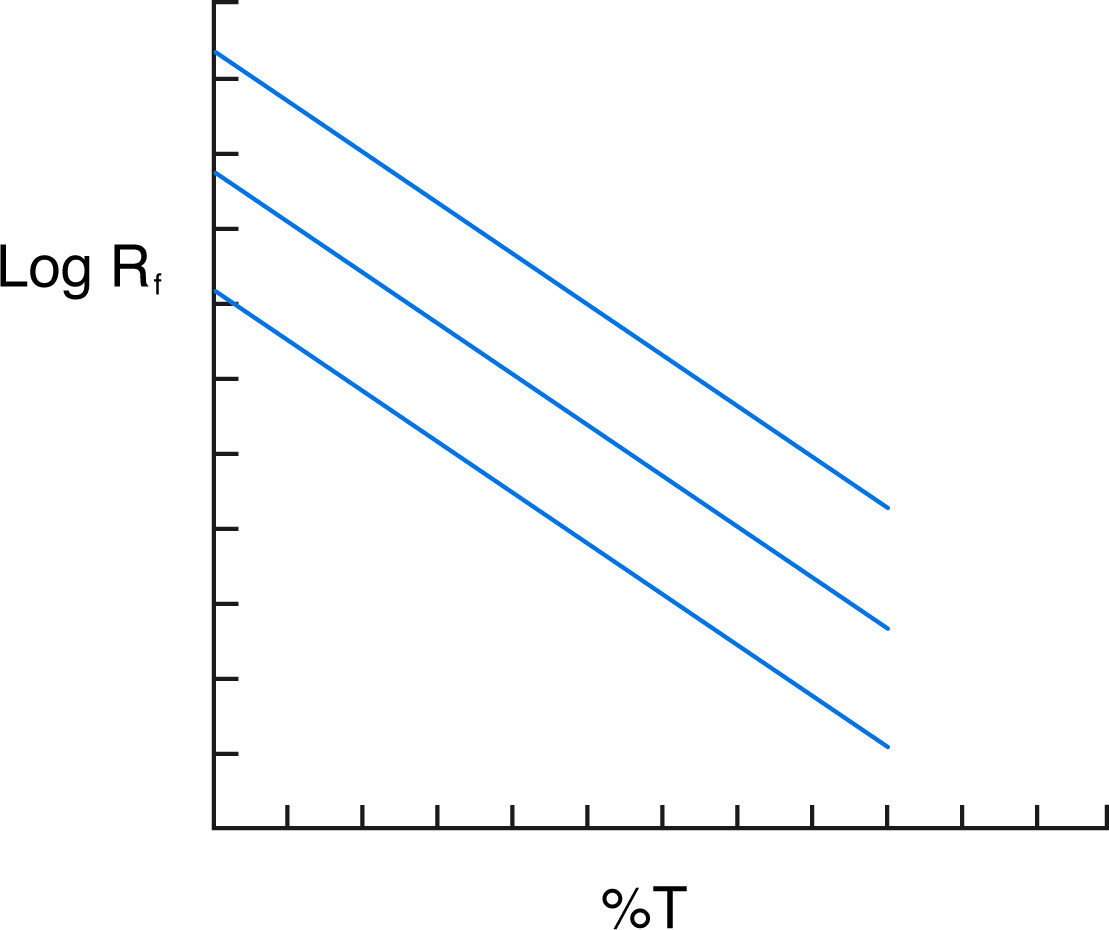
Ferguson plot shows three proteins of the same mass but different charges.
Native Gradient Gels
Another less laborious way of simplifying the interpretation of native PAGE gels is to run a gradient gel. Native gradient gels are poured in the same manner as gradient SDS PAGE gels. As proteins migrate through the increasing acrylamide concentration, into regions of ever smaller pore sizes, their mobility decreases. Eventually, each protein reaches its "pore-limit", at which point it slows to a minimum migration rate, which is constant for all proteins at their pore limit. The band pattern is stabilized at this point, so that gradient native gel PAGE approaches an equilibrium system, in that beyond a certain run length only minimal changes occur in the gel pattern.
Once proteins reach their pore limit, their relative positions are a direct reflection of their molecular weight. In a linear gradient, the logarithm of the molecular weight is proportional to log Rf over a wide range, although the curve is actually sigmoid in shape. This type of analysis is more subject to artifacts than the Ferguson plot but is easier to carry out.
Finally, native gradient gels may be analyzed with activity stains, which simplify the pattern by only visualizing enzyme activities of interest. This can be useful when purifying an enzyme from a mixture of isozymes, or when studying the expression or activity of enzyme families. It also allows for the isolation of electrophoretically pure, active enzymes. Used in conjunction with gradient gels, activity stains can provide molecular weight information about otherwise uncharacterized enzymes. Of course, the technique is limited to enzymes for which chromogenic or chemiluminescent assays exist. Often an assay can be adapted from existing techniques with little effort. The critical requirement is that a colored compound be deposited in the gel in an insoluble form, either by the enzyme (positive stain) or in a reaction inhibited by the enzyme (negative stain).
NEXT TOPIC: Sample Preparation for Native Protein Electrophoresis
- Sample Preparation for SDS-PAGE
- Sample Preparation for Native Protein Electrophoresis
- Peptide Mapping
- Native Protein Electrophoresis
- Measuring Molecular Weight with SDS-PAGE
- Isotachophoresis
- Isoelectric Focusing
- Immuno-Electrophoresis / Immuno-Diffusion
- Gel Preparation for Native Protein Electrophoresis
- Gel Electrophoresis of RNA & Post Electrophoretic Analysis
- Denaturing Protein Electrophoresis: SDS-PAGE
- Casting Gradient Gels
- Activity Stains